

A quantitative analysis of wheel segment distributions, expected value formulas, multiplier compounding, and structural house advantages across top live dealer game shows.
Live dealer game shows have experienced explosive growth across global online gambling markets. Combining the production value of high-budget television broadcasts with high-frequency Random Number Generator (RNG) multipliers, platforms entice players with potential payouts exceeding 10,000x or even 25,000x their initial stake. Games like Crazy Time, Monopoly Live, Sweet Bonanza Candyland, and Mega Wheel dominate player traffic, often processing higher betting volumes than standard live blackjack or roulette tables.
However, behind the high-energy hosts and theatrical wheel spins lies a highly sophisticated mathematical architecture designed to extract a significantly higher house advantage than traditional table games. While European Roulette enforces a fixed 2.70% house edge and Banker bets in Baccarat carry a 1.06% edge, live casino game show expected value calculations reveal house edges that range anywhere from 3.50% to well over 10.00% depending on individual segment selection.
To execute a data-driven strategy, players must discard emotional momentum and analyze the exact structural odds, segment distributions, top slot multiplier compounding, and return-to-player (RTP) differentials governing these live wheel games.
The Mathematical Framework: Expected Value (EV) & Volatility Equations
Every position on a live betting wheel possesses an individual Expected Value ($EV$), defined as the weighted average outcome of a wager across an infinite sample size of spins. The generalized mathematical formula for calculating the $EV$ of any wheel wager is expressed as:
Where:
- $P_i$: The exact statistical probability of landing on a specific wheel segment $i$.
- $R_i$: The total payout return (multiplier profit + returned unit stake) for segment $i$.
- 1: The original 1-unit wager deducted from the bankroll.
When $EV = 0$, the wager is mathematically fair. When $EV < 0$, the result represents the explicit house advantage. To calculate the percentage House Edge ($HE$), we use:
Unlike standard roulette where every pocket yields the identical 2.70% house edge, live dealer wheels utilize variable probability mapping. Each distinct bet type on the wheel carries a completely different mathematical expectation.
Structural Breakdown: Crazy Time Wheel Probability & EV Calculations
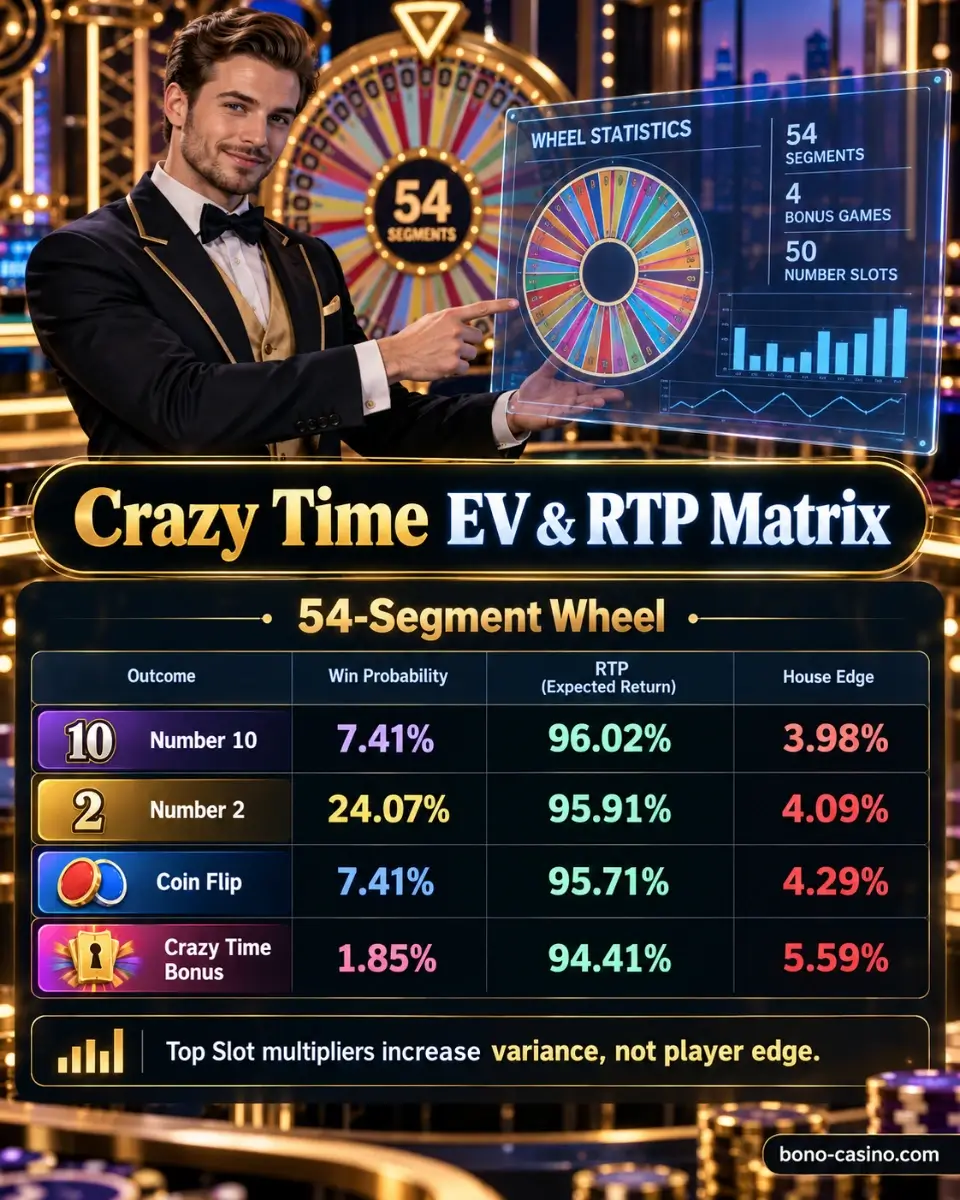
To understand how software developers structure wheel odds, we must analyze the industry flagship: Evolution Gaming’s Crazy Time. The Crazy Time wheel consists of exactly 54 uniform physical segments. The board is divided between standard numerical payouts (1, 2, 5, 10) and four distinct bonus games (Coin Flip, Cash Hunt, Pachinko, Crazy Time).
Base Game Segment Distribution & Raw Odds
Below is the complete, un-multiplied mathematical breakdown for each segment on the 54-pocket wheel:
- Number 1 (21 Segments): Winning Probability $P = 21/54 \approx 38.89\%$. Base Return $R = 2$ units. Raw $EV = (21/54 \times 2) – 1 = -22.22\%$ Base House Edge (mitigated down to 5.55% average House Edge / 94.45% RTP by Top Slot multipliers).
- Number 2 (13 Segments): Winning Probability $P = 13/54 \approx 24.07\%$. Base Return $R = 3$ units. Raw $EV = (13/54 \times 3) – 1 = -27.78\%$ Base House Edge (mitigated down to 4.09% House Edge / 95.91% RTP via Top Slot).
- Number 5 (7 Segments): Winning Probability $P = 7/54 \approx 12.96\%$. Base Return $R = 6$ units. Raw $EV = (7/54 \times 6) – 1 = -22.22\%$ Base House Edge (mitigated down to 4.21% House Edge / 95.79% RTP via Top Slot).
- Number 10 (4 Segments): Winning Probability $P = 4/54 \approx 7.41\%$. Base Return $R = 11$ units. Raw $EV = (4/54 \times 11) – 1 = -18.52\%$ Base House Edge (mitigated down to 3.98% House Edge / 96.02% RTP—the mathematically optimal numerical wager).
The Role of Top Slot Multipliers in Long-Term RTP
Without external mechanics, the raw house edge of a 54-segment wheel paying standard odds would be statistically unplayable (averaging an 18% to 27% house edge). To correct this baseline deficit, the studio incorporates a two-reel Top Slot Generator that spins concurrently with the physical wheel.
The Top Slot assigns a random multiplier (ranging from 2x up to 50x) to a specific wheel segment. If the physical wheel stops on that exact segment, the base payout or bonus feature payout is multiplied accordingly. Mathematically, the Top Slot acts as a volatility transformer. It compresses standard game payouts down while injecting explosive variance into rare hit events, elevating the long-term combined game RTP to between 94.33% and 96.02%.
| Segment Selection | Wheel Pockets (Out of 54) | Win Probability | Average RTP (With Top Slot) | House Edge |
|---|---|---|---|---|
| Number 1 | 21 | 38.89% | 94.45% | 5.55% |
| Number 2 | 13 | 24.07% | 95.91% | 4.09% |
| Number 5 | 7 | 12.96% | 95.79% | 4.21% |
| Number 10 | 4 | 7.41% | 96.02% | 3.98% |
| Coin Flip Bonus | 4 | 7.41% | 95.71% | 4.29% |
| Pachinko Bonus | 2 | 3.70% | 94.33% | 5.67% |
| Cash Hunt Bonus | 2 | 3.70% | 94.47% | 5.53% |
| Crazy Time Bonus | 1 | 1.85% | 94.41% | 5.59% |
Comparing variance across live table formats? Analyze how progressive betting mechanics handle extreme drawdowns in our Dragon Tiger Martingale Strategy guide.
Comparative Analysis: Monopoly Live Bonus Round Odds vs. Competitors
Evolution’s Monopoly Live and Pragmatic Play’s Sweet Bonanza Candyland utilize similar structural engines, but introduce key algorithmic variations in their bonus games that alter the overarching house edge.
Monopoly Live: Roll Probability Distribution
Monopoly Live features a 54-segment wheel where 4 segments trigger the 3D Monopoly board bonus: 3 segments for “2 Rolls” and 1 segment for “4 Rolls”. When entering the 3D board, movement is dictated by rolling two standard 6-sided dice ($2d6$). The probability distribution for $2d6$ is non-linear, forming a triangular distribution with 7 being the most frequent mathematical total:
P(Roll 2 or 12) = 1 / 36 = 2.78%
P(Doubles) = 6 / 36 = 16.67%
Rolling “Doubles” grants an extra roll. Because properties further down the Monopoly board (Mayfair/Boardwalk) contain compounding multipliers, hitting doubles on the initial roll drastically increases the mathematical expected payout. Overall, Monopoly Live establishes a total game RTP of 96.23% on 2 Rolls and 93.90% on 4 Rolls.
Sweet Bonanza Candyland EV Calculation
Pragmatic Play’s Sweet Bonanza Candyland alters segment distributions on its 54-pocket wheel to offer a slightly different payout profile:
- Number 1: 23 segments | 42.59% hit frequency | 96.48% RTP
- Number 2: 15 segments | 27.78% hit frequency | 96.08% RTP
- Number 5: 7 segments | 12.96% hit frequency | 96.42% RTP
- Sweet Spins: 2 segments | 3.70% hit frequency | 95.85% RTP
- Candy Drop: 2 segments | 3.70% hit frequency | 95.50% RTP
Pragmatic Play slightly raised the base RTP of its numerical segments (averaging ~96.30%) compared to Evolution’s numbers, while restricting top-end bonus game frequency to maintain operator profit margins.
Prefer zero-variance mathematical models? Read our mathematical proof on the Baccarat Flat Betting Strategy to learn why constant unit sizing outperforms aggressive progressions.
Market Leader Blueprint: Best Live Game Shows to Play
When evaluating top-tier titles, players must balance maximum theoretical RTP against capital preservation needs.

1. Evolution Gaming
Flagships: Crazy Time, Monopoly Live
RTP Range: 94.33% – 96.23%
Profile: Industry leader in visual immersion and top-end multiplier mechanics. Features dynamic physical wheels combined with complex RNG sub-games.
2. Pragmatic Play Live
Flagships: Sweet Bonanza Candyland, Mega Wheel
RTP Range: 95.50% – 96.51%
Profile: Highly responsive mobile interfaces. Incorporates drop-multiplier mechanics derived from their flagship slot titles.
3. Playtech Live
Flagships: Spin a Win, Adventures Beyond Wonderland
RTP Range: 95.45% – 96.05%
Profile: Utilizes innovative card-deck mechanics alongside wheels. Introduces persistent side-bets and multi-tier progressive jackpots.
4. BetGames
Flagships: Wheel of Fortune, Classic Wheel
RTP Range: 95.00% – 96.20%
Profile: Streamlined, low-complexity betting engines focused purely on rapid executions and fixed statistical odds rather than theatrical bonus games.
Portfolio Optimization: Hedging vs. Volatility Harvesting
Because live game shows enforce a variable house edge across different pockets, attempting to play without a defined bankroll model results in swift capital depletion.
The Full-Coverage Fallacy
A common mistake among novice bettors is covering all 54 segments on a wheel simultaneously to ensure they participate in every bonus round that hits.
Net Returns on Full Wheel Coverage (54 Total Units Staked):
- If Number 1 Hits (38.89% probability): Returns 2 units (Net Loss: -52 units)
- If Number 2 Hits (24.07% probability): Returns 3 units (Net Loss: -51 units)
- If Number 5 Hits (12.96% probability): Returns 6 units (Net Loss: -48 units)
- If Number 10 Hits (7.41% probability): Returns 11 units (Net Loss: -43 units)
Unless an extraordinary Top Slot multiplier (e.g., 20x+) aligns perfectly with a winning number or bonus segment, blanket coverage guarantees a massive negative expectation per spin.
The 70/30 Optimal Allocation Strategy
To balance capital preservation with multiplier capture, quantitative models suggest a split-allocation portfolio:
- Base Layer (70% Budget Allocation): Place wagers on low-variance, higher-RTP numerical positions (specifically Number 10 or Number 2). Number 10 carries the highest base game RTP (96.02%) and provides an 11-unit return upon hitting, insulating the session bankroll.
- Growth Layer (30% Budget Allocation): Distribute remaining capital across high-ceiling bonus segments (e.g., Cash Hunt or Crazy Time).
By utilizing low-variance numerical wins to rebate session expenses, players extend their table endurance, increasing the total number of wheel spins experienced per session and raising the statistical probability of capturing rare 500x+ RNG multiplier events.
Looking for advanced live dealer math? Read our deep dive into Live Lightning Roulette Math to examine how modified paytables fund high-frequency RNG multipliers.
Responsible Gambling
Live dealer casino game shows rely heavily on sensory stimulation, rapid camera cuts, and presenter energy to create an immersive entertainment environment. These psychological mechanics are engineered to heighten engagement and reduce a player’s focus on statistical probability. Regardless of the strategy deployed, the mathematical algorithms underlying these platforms guarantee a permanent statistical house advantage over time. Game shows should be approached strictly as entertainment, never as a tool for financial gain or debt recovery. Set firm, non-negotiable deposit ceilings and time limits prior to opening a session, only play with disposable capital you can afford to lose entirely, and immediately cease play if gambling causes personal stress or financial hardship.
